
A competitor list tells you who else bids. It rarely tells you what to change in your next response. A useful competitive assessment connects evidence about rivals to a specific bid decision.
Public award notices offer one source of that evidence. Compare the winning supplier, buyer, contract and published award details to identify patterns that may matter for a future tender. Avoid treating a single award as proof of a rival's wider performance.
The seven examples below show how to turn assessment into action, from a short SWOT session to analysis of published awards over time. Each includes a worked output and the bid decision it can support. For a broader market research perspective, see ricerche di mercato per PMI.
1. SWOT Analysis
A SWOT only helps when it changes a bid decision. Use it to compare one likely rival with your own position, then identify which evidence should shape the response.
For example, a facilities management SME pursuing a Scottish council framework could assess the incumbent like this:
- Strengths: three recent awards on Public Contracts Scotland, all from Scottish councils and referencing the same two clients.
- Weaknesses: neither of its last two published responses includes a social value commitment.
- Opportunities: limited framework coverage may leave routes to market open. Compare your own framework positions before deciding whether the incumbent has an advantage.
- Threats: the incumbent has held the contract for two terms, and the specification appears to reflect its reporting format.
Where a SWOT Usually Falls Apart
Unsupported points weaken the analysis. So does a grid crowded with fifteen items per box. Keep each claim tied to evidence you can name, such as an award notice, case study, job advert or published response.
Practical rule: no source, no line in the grid.
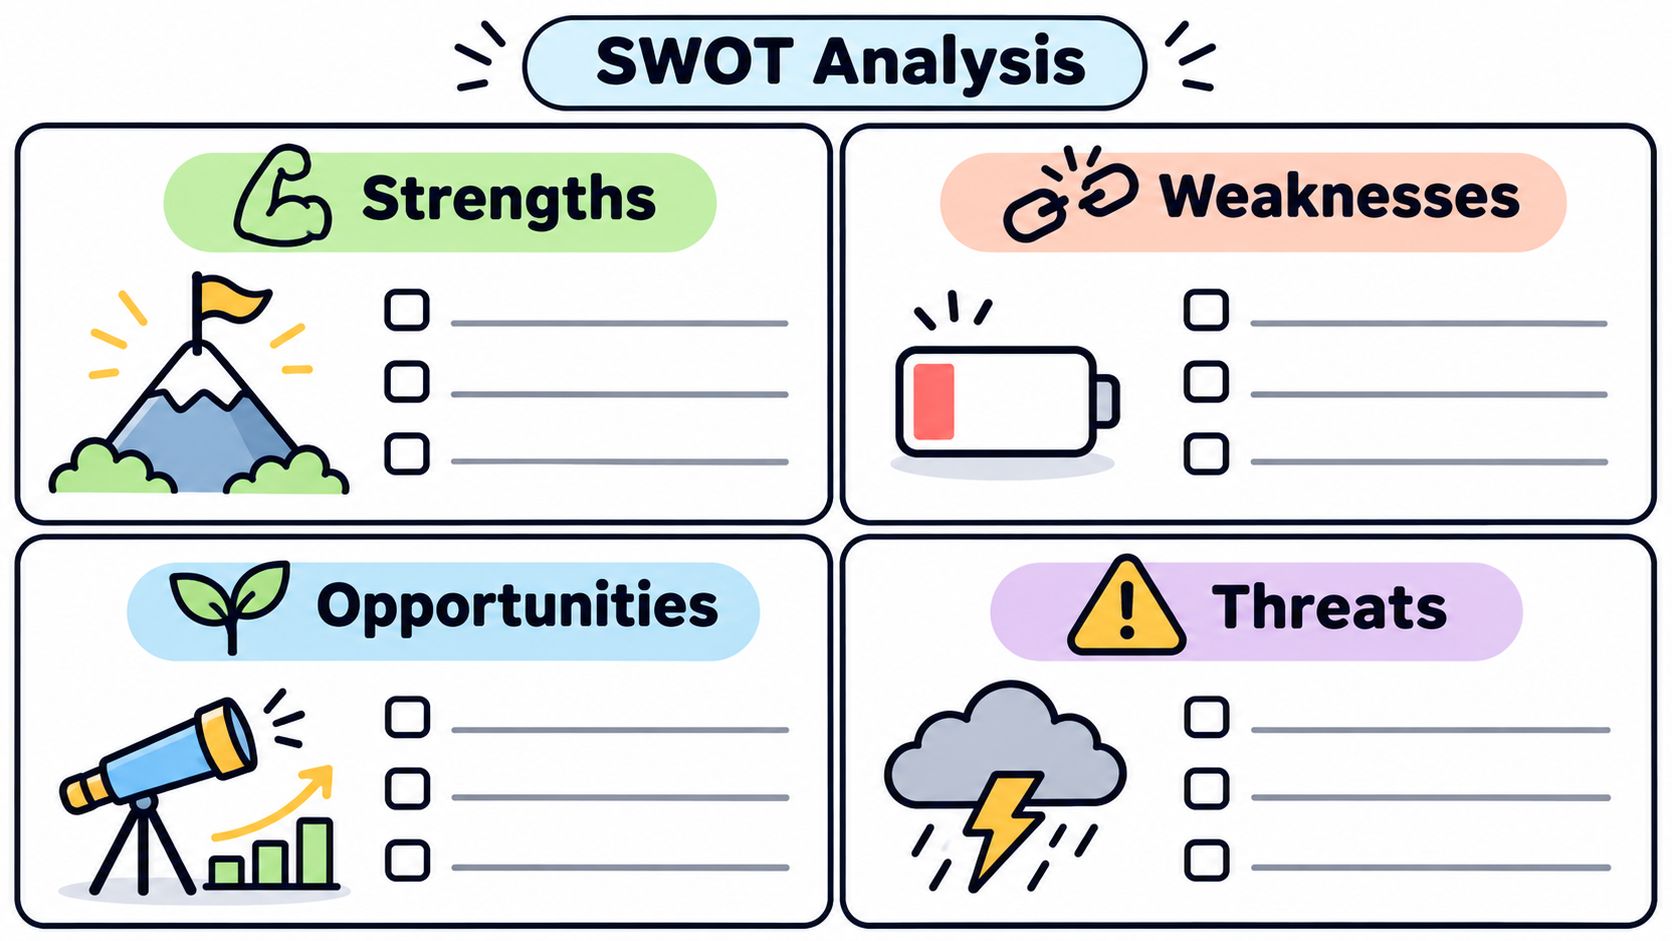
Limit each box to five or six points, attach the supporting evidence, and review the analysis after a major contract result or each quarter. Then connect the findings to the evaluation criteria. If your evidenced strength addresses a high-weighted criterion and the incumbent's weakness affects that same criterion, make it a win theme. If the two do not align, choose a different point to lead with.
2. Porter's Five Forces
A market can have few obvious rivals and still be hard to win. Porter's Five Forces examines the pressures shaping competition: new entrants, supplier power, buyer power, substitutes and rivalry. For UK public sector tenders, buyer power often deserves close attention because authorities set the specification, price envelope and allocation of risk.
Scoring It for a Council Market
Score each force out of five and add one sentence explaining the rating. The explanation matters more than the number.
Consider a cleaning contractor serving regional councils. Buyer power scores 5 if four authorities account for most of the spend within a practical travel radius. Threat of new entrants scores 4 in local government, where entry may be easier than in central government. Rivalry scores 3 if national suppliers compete with a strong regional incumbent. Supplier power scores 2 when cleaning materials are widely available. The threat of substitutes scores 2 if councils could bring services back in-house.
Compare the same forces across buyer types. The House of Commons Library reports that SMEs received 21% of public procurement by value overall, with shares of 34% for local government, 16% for the NHS and 10% for central government (Commons Library briefing on SME procurement). That variation gives a contractor a reason to test its market assumptions by segment, rather than treating public procurement as one market.
Framework access can change the route into a specific buyer group. For a broader theoretical view, structural and dynamic competition models extend the analysis beyond the classic Five Forces.
Worked Output: From Scores to a Bid Decision
| Force | Score | Reason | Bid implication |
|---|---|---|---|
| Buyer power | 5 | Four councils account for most nearby spend. | Prioritise the councils where the service and geography fit. |
| New entrants | 4 | Local-government entry appears more accessible than central-government entry. | Check eligibility and evidence requirements before committing bid time. |
| Rivalry | 3 | Two national suppliers and a strong regional incumbent compete. | Identify a specific service or delivery advantage in the tender criteria. |
| Supplier power | 2 | Cleaning materials are commoditised. | Avoid making materials the main differentiator. |
| Substitutes | 2 | In-house delivery is a possible alternative. | Address the buyer's reasons for outsourcing in the response. |
Use award data to test buyer concentration. Count distinct buyers appearing in your CPV codes over twelve months, then compare that pattern across buyer types. Write a sentence for every score. Finally, rank two or three buyer and framework combinations as bid targets. If the evidence points to high rivalry and concentrated buyer power, pursue tenders where your delivery fit is strongest, rather than spreading effort across the whole market.
3. Feature Comparison Matrix
This one is a grid: capabilities down the side, suppliers across the top. Rows might be certification status, out-of-hours cover, average response time, pricing model and support hours. Columns are you plus the rivals you meet.
The matrix earns its keep when the rows come from the buyer's own criteria. Under section 23 of the Procurement Act 2023, award criteria must relate to the contract's subject matter and be clear, measurable, specific and proportionate to the contract's nature, complexity and cost, as set out in the Procurement Act 2023. Contracting authorities must also publish an assessment methodology stating whether failing a criterion disqualifies a tender and showing relative importance by percentage weighting or ranking, per section 23 of the Act.
What the Worked Output Looks Like
Say an IT support provider is bidding on a framework lot. Its grid has five rows taken from the published criteria and five columns: itself plus four rivals. The result is blunt. Two rows where it leads clearly, one tie, two where it trails. The two trailing rows carry roughly 40% of the available marks, which means no amount of polish on the leading rows recovers the bid.
A matrix that flatters you is worse than no matrix at all. Score your own column last, and score it as the buyer would.
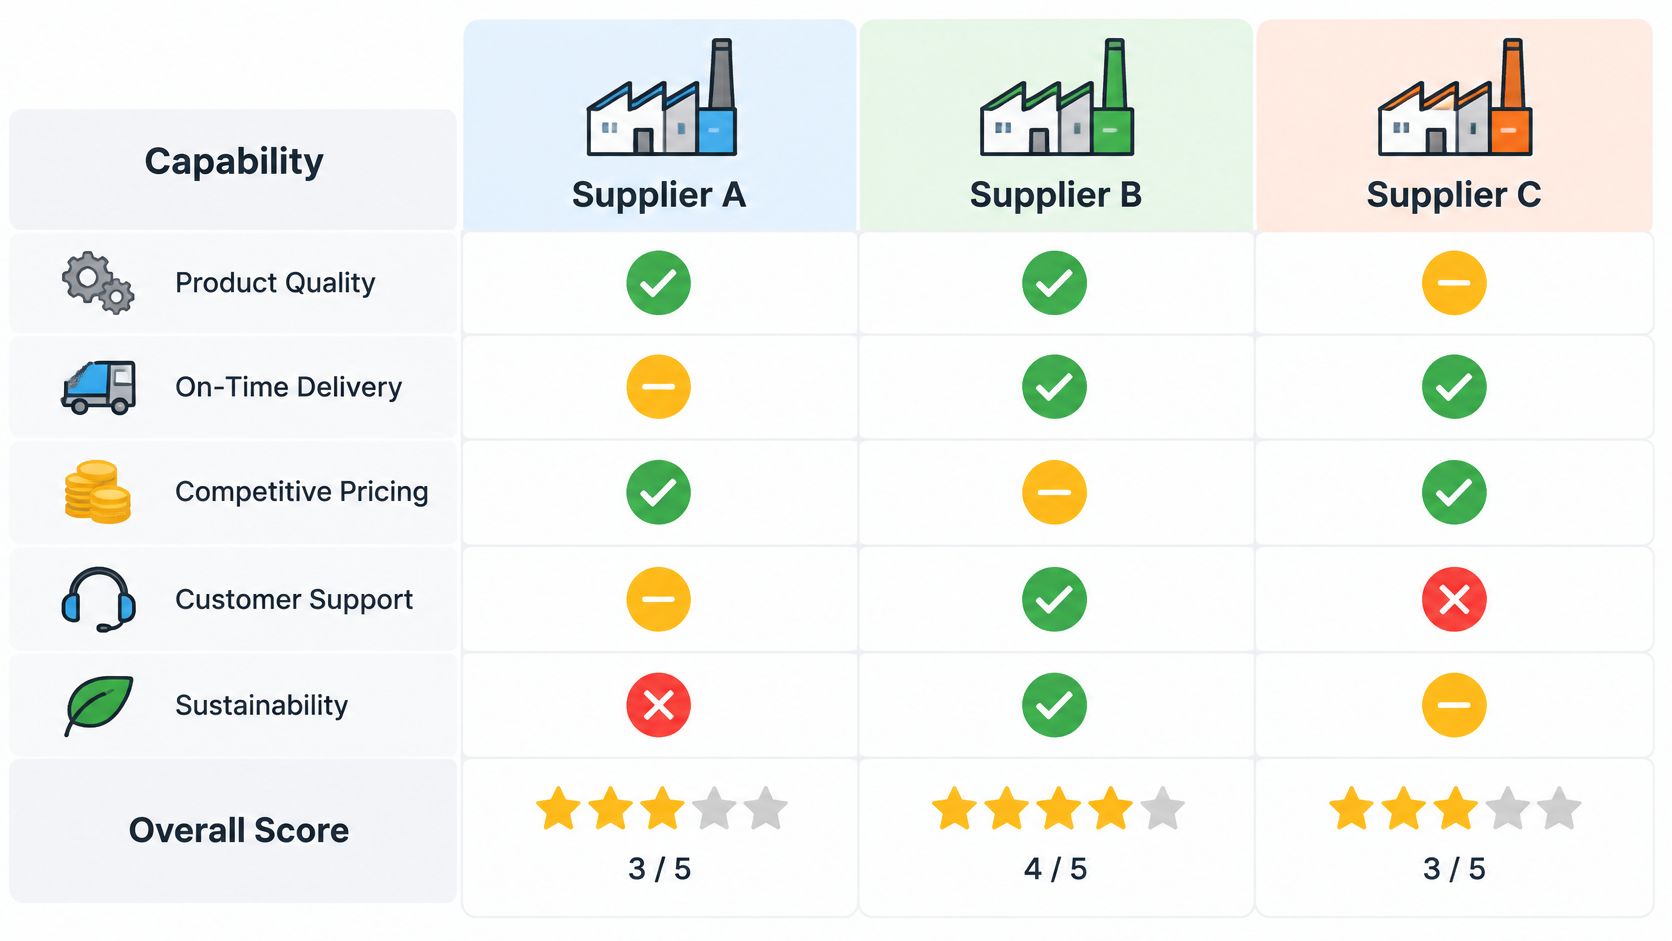
Keep a source and a date against every cell, because a certification claim that's two years stale will embarrass you in a clarification meeting. If you're weighing tools to hold the grid and its supporting evidence in one place, Bidwell against Loopio is a fair comparison, and the broader category of competitive analysis software covers the rest. The bid decision is a gap plan: pick the two trailing rows, gather the evidence, and either fix them before submission or accept the loss now.
4. Perceptual Positioning Map
Plot competitors on two axes that represent what buyers care about. Price against quality is the lazy version. Specialism against breadth, or technical depth against speed of mobilisation, tells you more.
Take a construction consultancy bidding for a highways framework. It plots six rivals on technical depth and speed of mobilisation. The chart shows a dense cluster in the slow, deep corner and almost nothing in the fast, specialist corner. That empty space becomes the win theme, provided the buyer's own stated priorities reward it.
One Map per Buyer Segment
The mistake is drawing a single map of "the UK public sector". In 2024, the wider UK public sector spent £45.4 billion directly with SMEs, up from £42.4 billion in 2023, yet SMEs received only 20% of total direct public-sector procurement spending, according to the British Chambers of Commerce. Local government was far more open, giving SMEs 35% of its procurement spending, worth £28.1 billion.
That gap means a positioning that works in a district council will often fail in a central government department, where scale, framework access and incumbent relationships change the axes entirely. Draw one map per buyer type.
- Take axes from the tender documents: if the evaluation weights mobilisation at 20%, mobilisation belongs on an axis.
- Test placements against results: recent wins and losses should roughly agree with where you've put everyone, including yourself.
- Keep it to six competitors or fewer: a crowded chart communicates nothing.
The bid decision here is positioning. Whichever corner you claim on the chart has to be the corner the buyer is scoring, or you've built a nice slide for an internal meeting.
5. Competitor Battlecards
A battlecard turns competitor research into a bid decision. Keep one page per rival, focused on where they compete, what risks their approach may create for delivery, and what evidence your response should put forward.
A UK telecoms SME joined the Crown Commercial Service Network Services framework in July 2015. Its turnover rose 297% over three years, from roughly £4.0m to £16.0m, while public sector work grew to 60–70% of its business, according to the government case study on the supplier. A rival's framework access and growth can signal where it may be competitive, but neither proves it will meet the buyer's requirements on this contract.
One Page, Four Blocks
Who they are and where they win. Record the frameworks they hold, sectors they serve, contract sizes and reference clients. Use details relevant to the opportunity, not a general company profile.
Where their delivery may be vulnerable. Note risks you can support with evidence, such as limited rural coverage or a transition plan dependent on one regional engineer. Treat these as questions to test, not established weaknesses.
How to address the comparison. Buyers need evidence against their requirements, not criticism of another supplier. Show how your own mobilisation plan, coverage model or service controls address the delivery risk.
Questions for the buyer. Ask, “How would you like continuity of service demonstrated during mobilisation?” The answer can clarify which evidence deserves space in the response.
Keep the card short enough to use during a clarification meeting or proposal review.
For a managed print bid, a supplier could keep one card per national rival and flag rural response-time risk as a point to test. It might ask the buyer how they will assess geographic coverage and response times, then decide whether to lead with its own coverage evidence. The card guides the response and clarification questions; it does not decide whether to bid. Assign an owner and update the card after each result.
6. Win/Loss Analysis
This is the only method built on your own outcomes. You request feedback, review your scores by criterion, and compare them with what the winning supplier is known to do well. Patterns show up after three or four bids that a single debrief would miss.
Price variance is where teams misread results most often. For NHS Supply2Health web-portal hosting, the winning SME took a £115,000 contract after demonstrating relevant experience, skills and capacity, and its bid was more than £200,000 below competing bids while the procurement stayed on schedule with simple, transparent documentation, per the Cabinet Office case study. The lesson isn't "bid low". It's that a large commercial gap beats incumbent scale when the evidence is credible.
Log Scores by Criterion, Not by Result
Government guidance on the social value model is clear that evaluators score bids using the evaluation methodology published in the tender documents, per the PPN 026 guidance. So your log should mirror that structure, criterion by criterion.
- Request a debrief inside the allowed window: after every loss, without exception, and ask which sections scored lowest.
- Record the score, the weighting and your evidence: a 3/5 on a 25% criterion explains a loss that a 3/5 on a 5% criterion doesn't.
- Split win rate by buyer type: a cleaning firm can win councils on price and lose NHS bids on social value evidence, and those are different fixes.
What to log: criterion, weighting, your score, the winning supplier if published, and one sentence on what your answer lacked.
The bid decision is a rewrite, not a shrug. A civil engineering SME that keeps losing method statements usually finds its risk management story is buried three sections down, and moving it changes the next three results.
7. Public Sector Award Analysis
Published award notices are free competitive intelligence and almost nobody uses them properly. Find a Tender, Contracts Finder, Public Contracts Scotland and Sell2Wales all publish winner, value, buyer and duration. Twelve to twenty-four months of that data shows who is active, how often incumbents keep contracts, and where new entrants appear.
There's plenty to work with. Contracts Finder recorded 34,968 awarded contracts in 2025/26, including 12,533 awarded to SMEs, per Contracts Finder data on the National Data Library.
Watch Renewal Dates, Not Just Winners
A worked example. A security services SME pulls eighteen months of notices for its CPV codes and finds three rivals taking most of the regional council lots, with renewal dates clustering in the same two months. That's a bid calendar, not just a competitor list.
Buyer-level variation is the other signal. The Department for Transport reported £1.2 billion in direct SME spend in 2024/25, just 5.0% of its total direct spend, per the DfT SME Action Plan. The Department for Education reported £295 million, or 30.5% of its £968 million published procurement spend, per the DfE SME Action Plan. Same country, same rules, very different access.
- Search all four portals: some buyers publish on only one.
- Log value and duration alongside the winner: a £90,000 two-year award is a different opportunity from a £2m four-year one.
- Tag notices that match your bid writing software shortlist criteria: sector, CPV code, region and value band, so the list stays usable.
The bid decision is prioritisation. If a buyer awards almost nothing to suppliers your size, deprioritise it and spend the hours elsewhere.
How the seven competitive assessment examples compare
| Item | Focus | Main evidence | Main drawback |
|---|---|---|---|
| SWOT Analysis | A rival's internal strengths and weaknesses, plus external opportunities and threats | Four-quadrant assessment supported by sources such as award notices, case studies, and job postings | Can become vague, lengthy, or outdated without evidence and regular reviews |
| Porter's Five Forces | Market structure and pressures affecting competition and profitability | Assessment of new entrants, suppliers, buyers, substitutes, and rivalry, informed by market and award data | Abstract and data-intensive; often needs refreshing |
| Feature Comparison Matrix | Side-by-side comparison of supplier capabilities against buyer criteria | Grid of capabilities or tender criteria, with scores or evidence for each supplier | Rival information can be difficult to verify, and criteria can become outdated |
| Perceptual Positioning Map | How buyers perceive competitors across two important attributes | Competitor positions plotted on buyer-relevant axes, informed by tender priorities and bid outcomes | Subjective axis choices can oversimplify the market |
| Competitor Battlecards | Practical guidance for responding to a specific rival in live bid and sales situations | One-page profiles covering strengths, weaknesses, pricing, objections, and talking points | Quickly becomes outdated without clear ownership and regular updates |
| Win/Loss Analysis | Reasons behind past bid outcomes and patterns across bids | Bid scores, buyer feedback, debriefs, and comparisons with winning suppliers | Feedback may be limited, and small samples can mislead |
| Public Sector Award Analysis | Which suppliers win public contracts, where, and at what value | Published award notices tracked by winner, value, duration, buyer, and sector | Data may be delayed and requires time to clean; awards do not explain why a supplier won |
Turn the Seven Examples Into a Bid Routine
Start with one method, not seven. The two that pay back fastest are usually a win/loss log and a light award review, because both feed directly into the next tender you write. Neither needs software, a consultant or a budget. A spreadsheet, four portals and forty minutes a month will do it.
Here's the sequence that sticks. Log every result by criterion for a quarter. In parallel, pull award notices for your main CPV codes and note who keeps winning. Once those two habits are running, add a battlecard for the rival you meet most often. Positioning maps and Five Forces come later, when you're choosing which markets to enter rather than which bid to write.
The wider picture supports the patience. DBT reported direct SME spend of 18.1% in 2024–25, up from 13.8% in 2023–24, per the DBT SME action plan. Participation is uneven by department, so your own evidence beats any national average.
Where Bidwell fits is the plumbing. Tender monitoring watches the UK portals and scores each notice against your past wins, so the award data you've been tracking turns into prompts. Your knowledge base holds the case studies, accreditations and biographies that make a gap plan fixable, and AI response generation drafts section by section against the buyer's published criteria for your team to review.
None of that replaces judgement. You still decide whether a buyer is worth the hours, whether a gap can be closed in time, and which win theme leads. If you're not sure where to begin, the free Tender readiness checker shows where your gaps sit before you commit to a bid.
Bidwell watches Find a Tender, Contracts Finder, Public Contracts Scotland and Sell2Wales, matches each notice to your sectors, CPV codes and past wins, and drafts a first-pass response from your own case studies, methodologies and team biographies. Your team reviews, sharpens the win themes and submits. If you'd rather test that on your next framework than on a live deadline, start at Bidwell.

